
ARLAS v28: Elevating Your Geospatial Analytics with 3D Terrain and Enhanced Collaboration
A lot has evolved since ARLAS Version 27, which introduced the stunning 3D 'globe view' and seamless COG integration. With Version 28, we're taking your data exploration to new heights. Literally.
At Gisaia, our key premise and promise remains simple: Don't Build Your Geo Data Platform from Scratch; Develop your geodata analytics service with ARLAS. We provide a robust, scalable foundation so you can bypass the costs and delays of building a platform, and instead focus entirely on unlocking the value of your Earth Observation and geospatial big data. In ARLAS v28, we introduce true 3D terrain mapping, more intuitive analytical widgets, seamless collaboration, and a significant core upgrade to Angular 21.
NEW FEATURES
3D Experience & Cartography: Layer Extrusion & Terrain Activation (DTM)
Flat maps don't always do justice to reality. For precise geographic analysis, users need to visualise the actual relief, elevation, and topography of a landscape to truly understand their data.
We’ve integrated a Digital Terrain Model (DTM) directly into the basemap. You can now instantly toggle the 3D terrain view to watch mountains, valleys, and slopes come to life. Alongside new 3D Layer Extrusion capabilities, this adds a crucial depth dimension to your geospatial insights, making environmental and infrastructural analysis significantly more immersive.
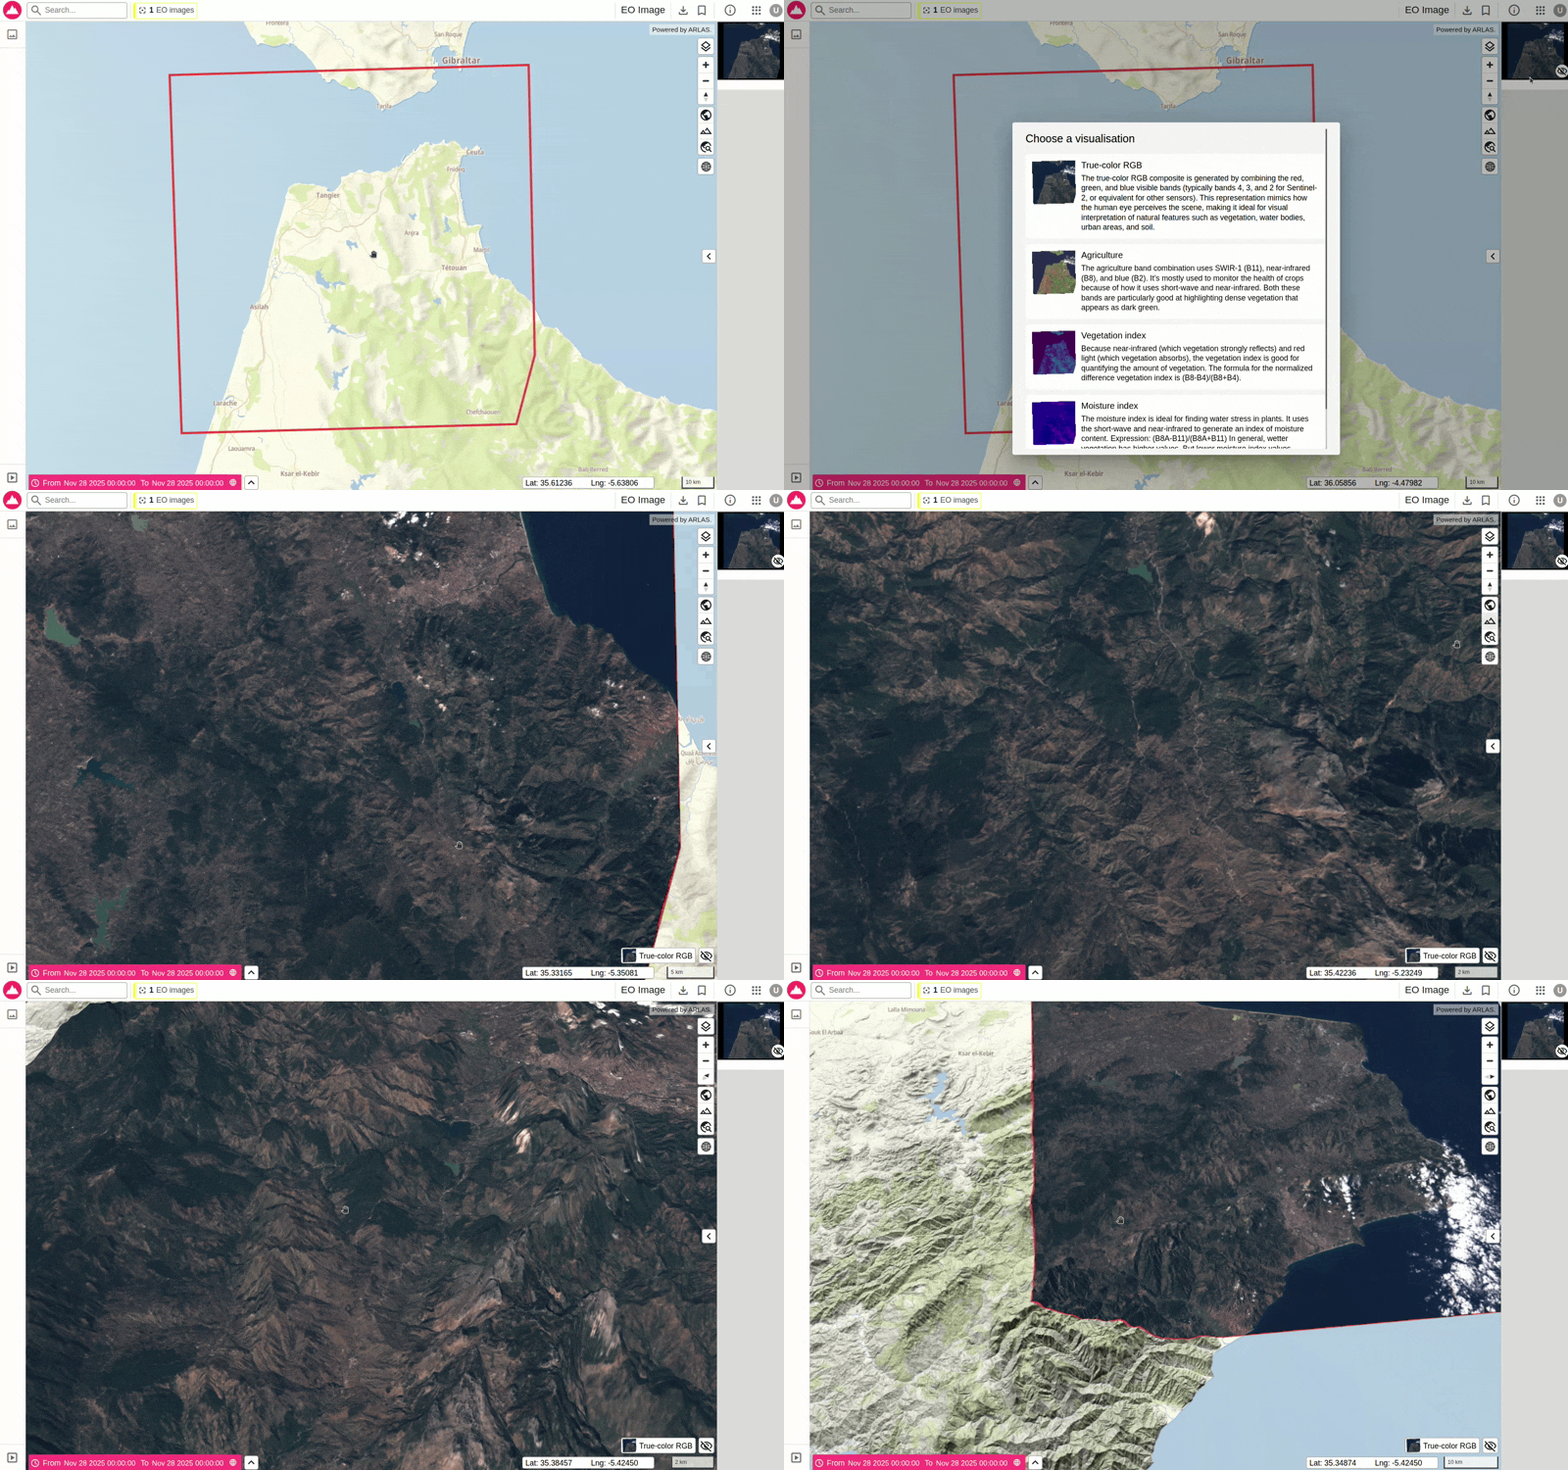
For example, activating the DTM uncovers intricate land elevation details, offering an ideal way to inspect Earth Observation products within their authentic terrain context. As illustrated in our ARLAS-EO demo snippet below, the generated Cloud Optimized GeoTIFF (COG) is directly mapped onto its actual elevation dataset.
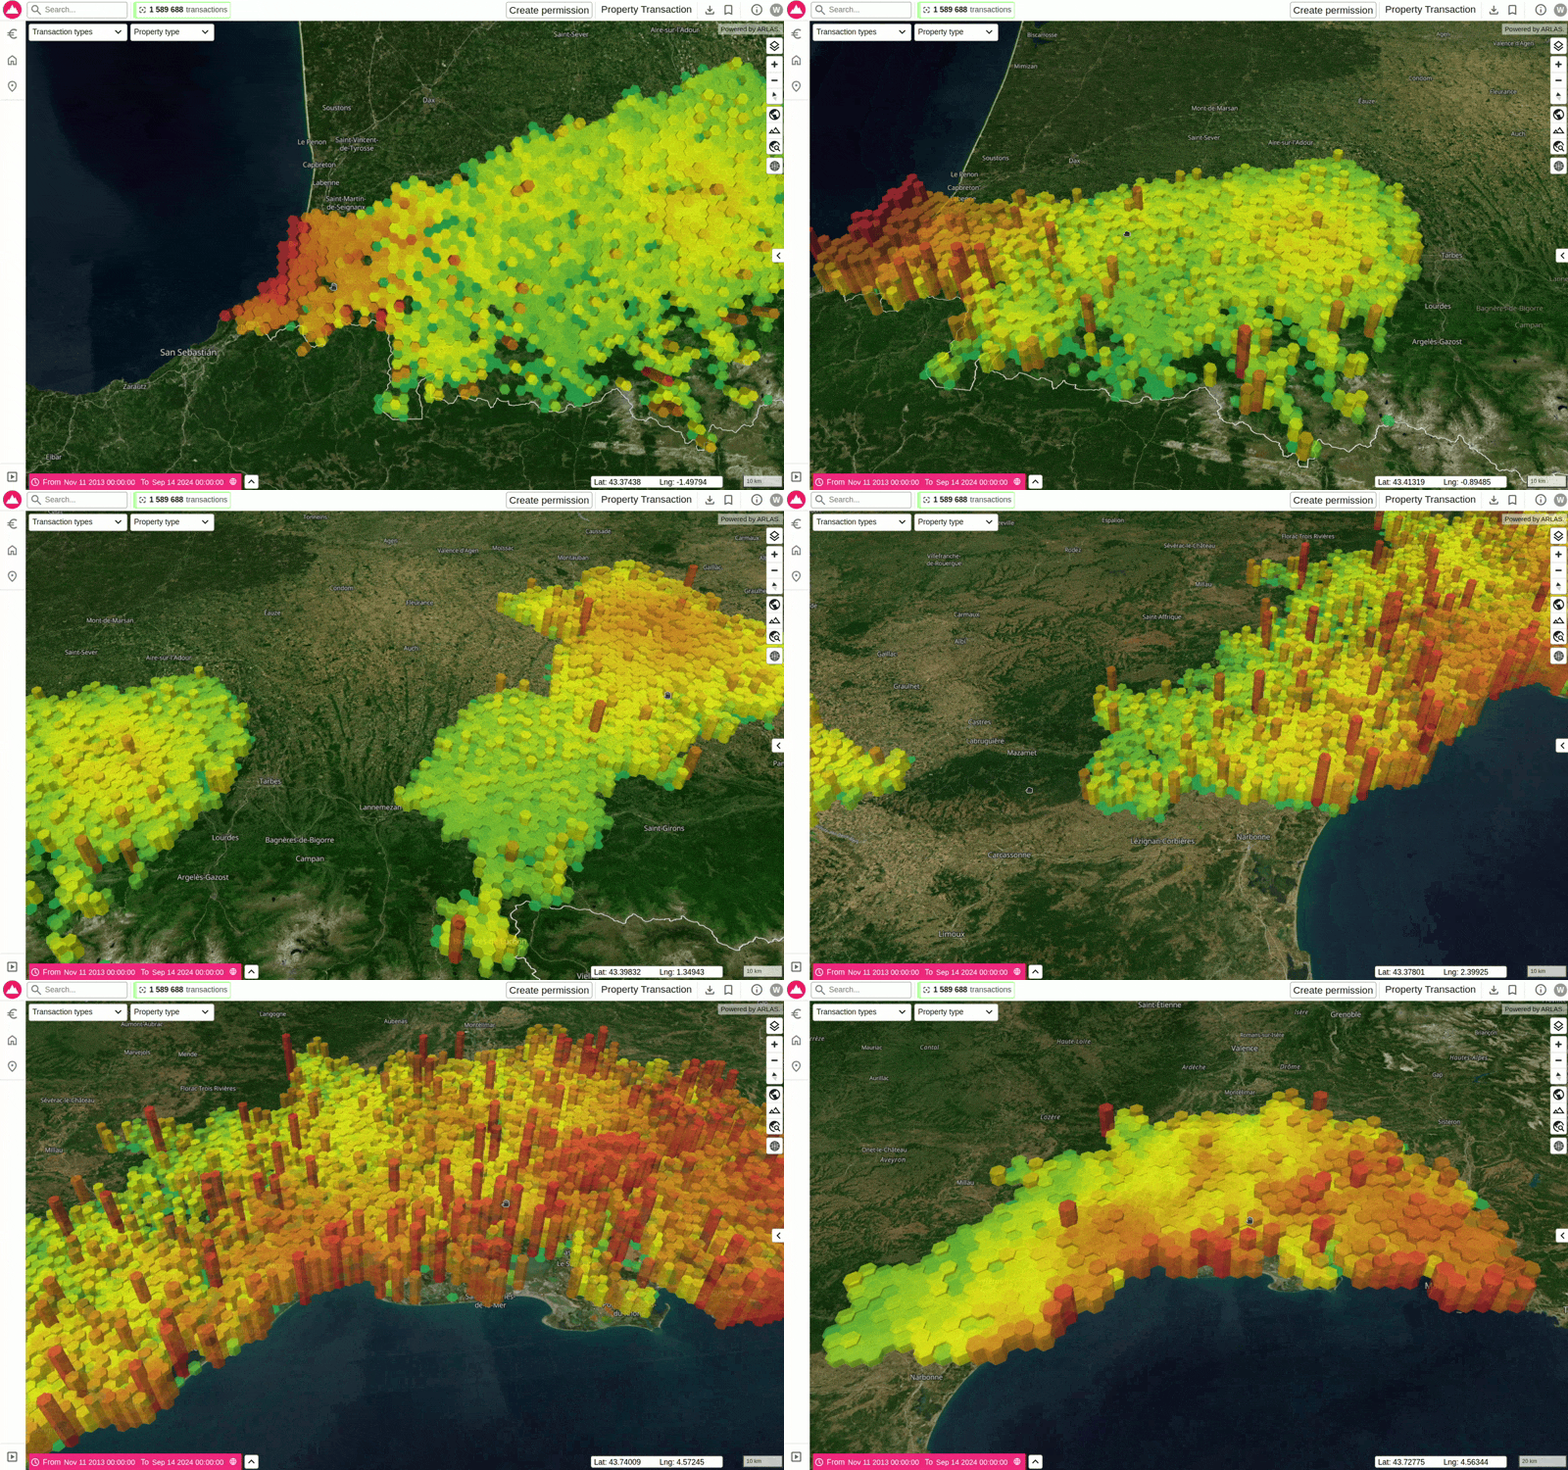
Below, the Layer Extrusion feature on our Property Transaction demo clearly highlights regions with the highest prices per square meter. While these premium areas are colored red and extruded to a taller height, locations with lower prices per square meter are shown in green and feature a lower height.
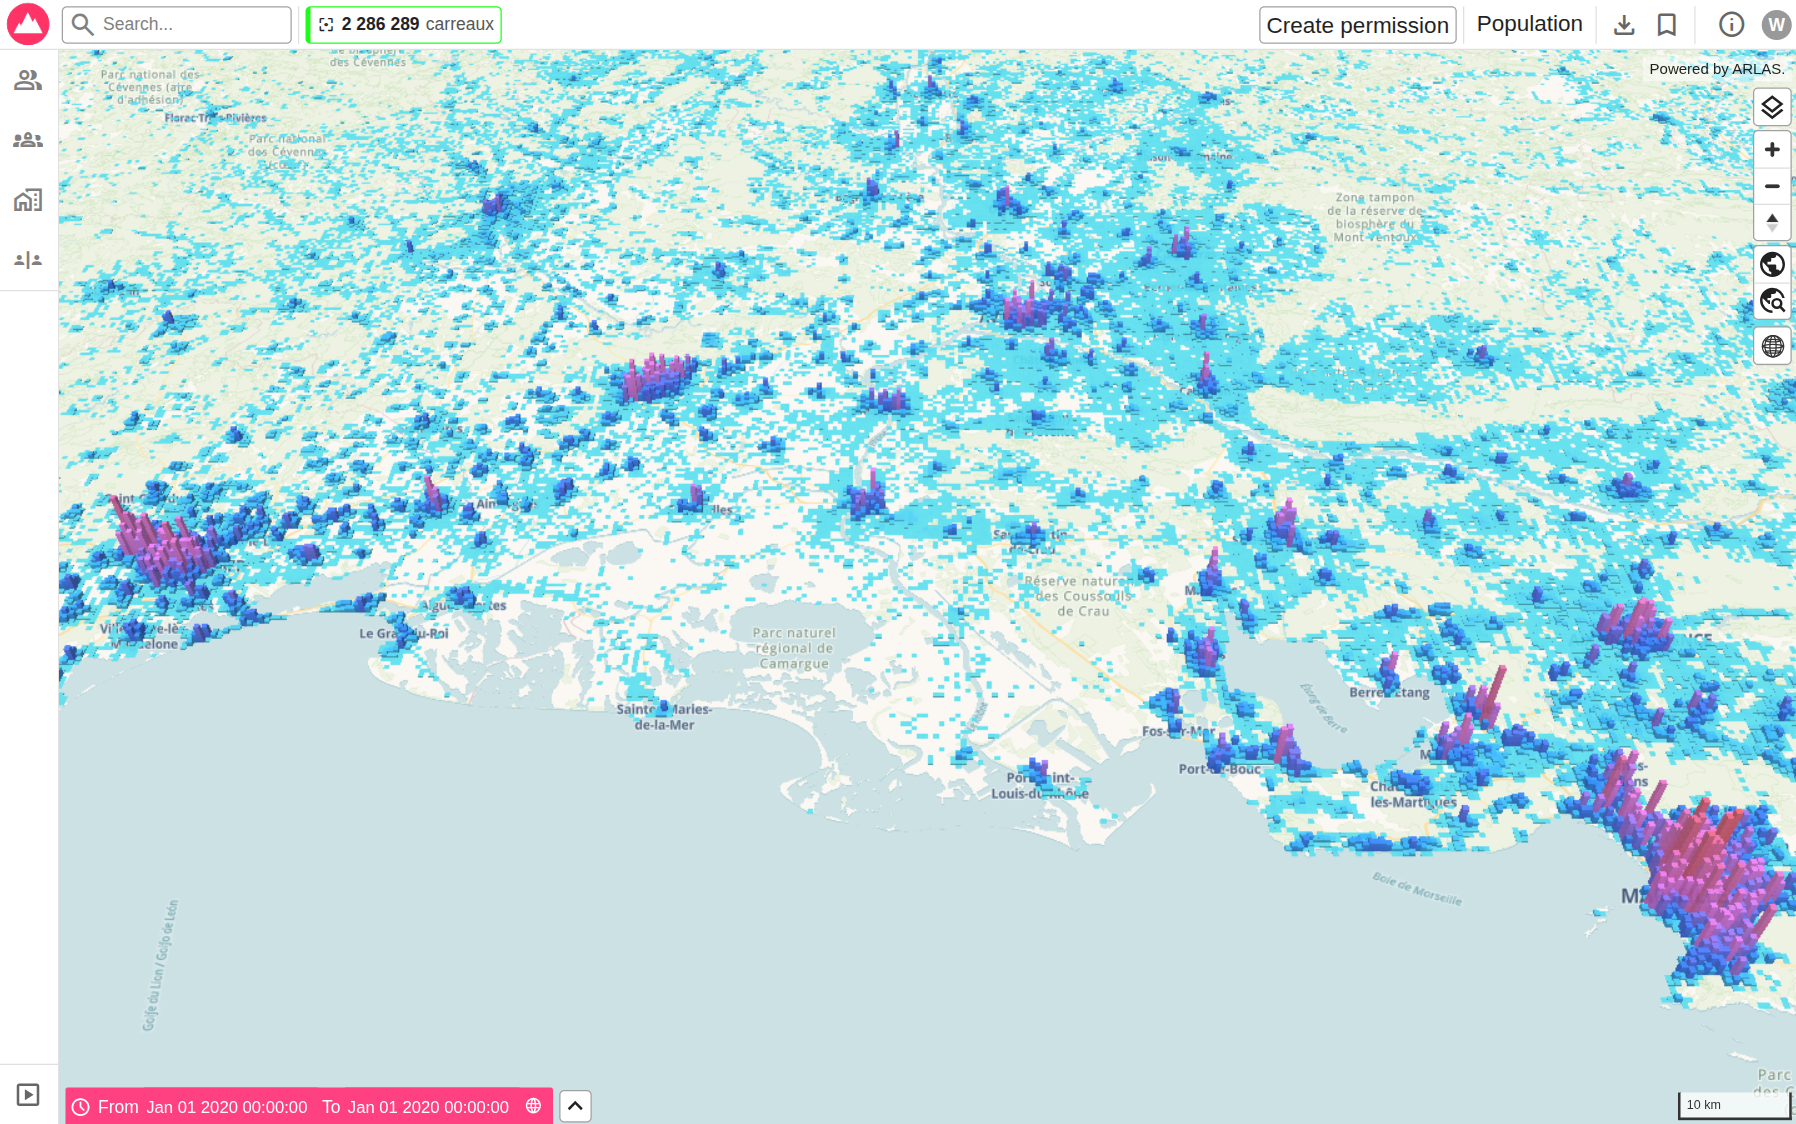
In the following image, our Population demo leverages the Layer Extrusion feature to visualise French National Institute of Statistics and Economic Studies (INSEE) data. This highlights national demographic concentrations, making population density peaks immediately apparent.
Swimlane Enhancements for Deeper Analytics
Our previous Swimlane view lacked visual depth and consistency with other charts, which made cross-referencing complex temporal data slightly tedious.
We've now upgraded the Swimlane component with two key features:
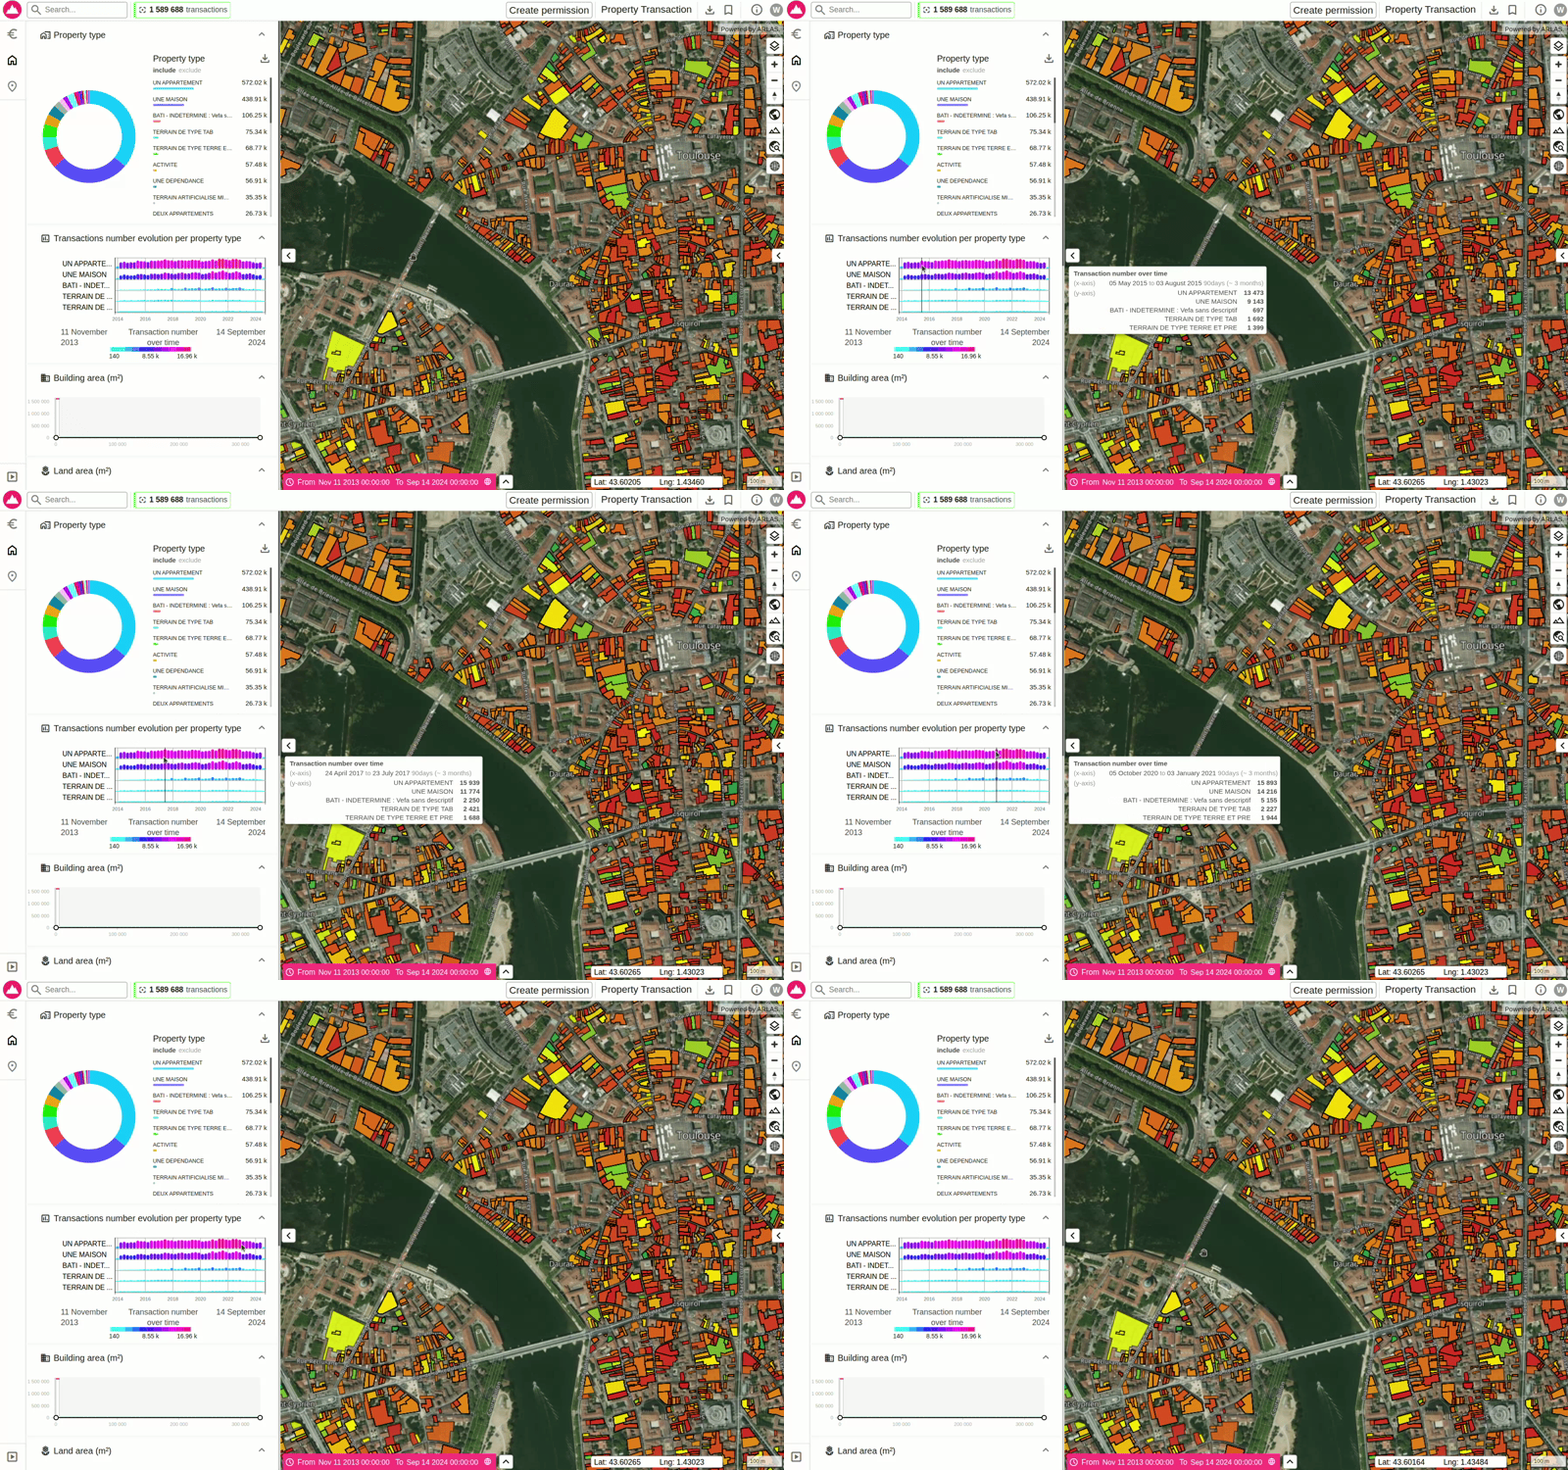
Harmonised Tooltips: Tooltips now share the exact same design and structure as the Histogram, allowing for seamless and intuitive switching between widgets.
Color Palettes: We’ve added new customizable color palettes so you can easily differentiate various data tracks and distributions at a glance.
As demonstrated below, this feature allows you to zoom in on specific swim lane details. This lets you quickly gather information regarding the number of property types transacted during a specific timeframe (in the case of the demo).
Improved Datatable Details View
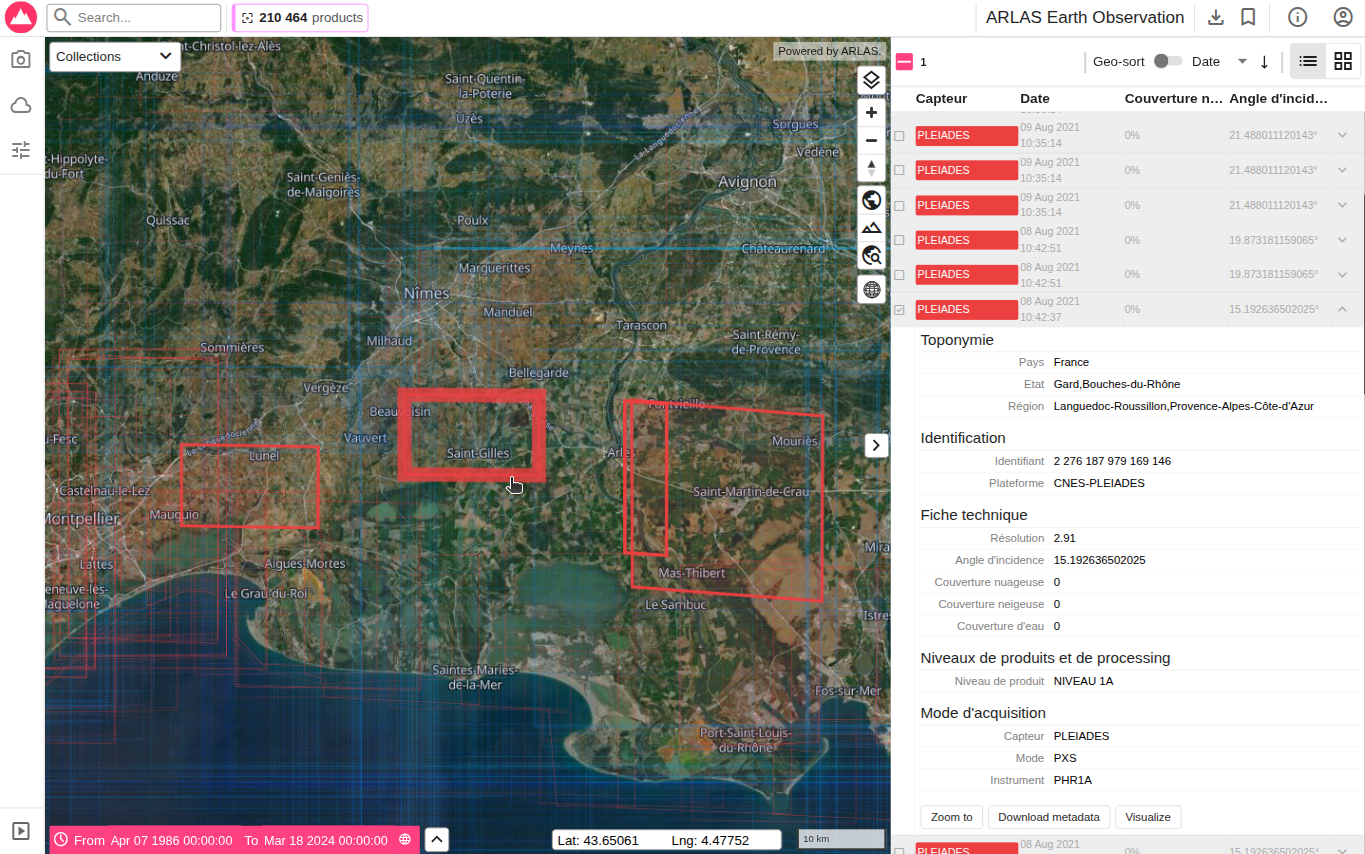
Reading raw metadata in a flat list can be difficult, making it hard to quickly inspect complex data layers and attributes.
We completely redesigned the details view to display structured metadata. Key-value pairs, nested fields, and tags are now beautifully organised into clean, highly readable sections.
This is incredibly useful when exploring diverse, multi-collection dashboards containing AIS tracks, Marine measures, and EO images all in one place.
We use the ARLAS Earth Observation catalogue demo below to illustrate this.
UI/UX & Design System: Switch to Material Symbols
By completely replacing our legacy icon set with Material Symbols, we have provided our interface with access to a significantly broader, more modern, and versatile library of icons. This transition ensures uniform styling and delivers a more polished, intuitive look throughout the entire application.
Collaboration & Data Management: Hub Collection Sharing Controls
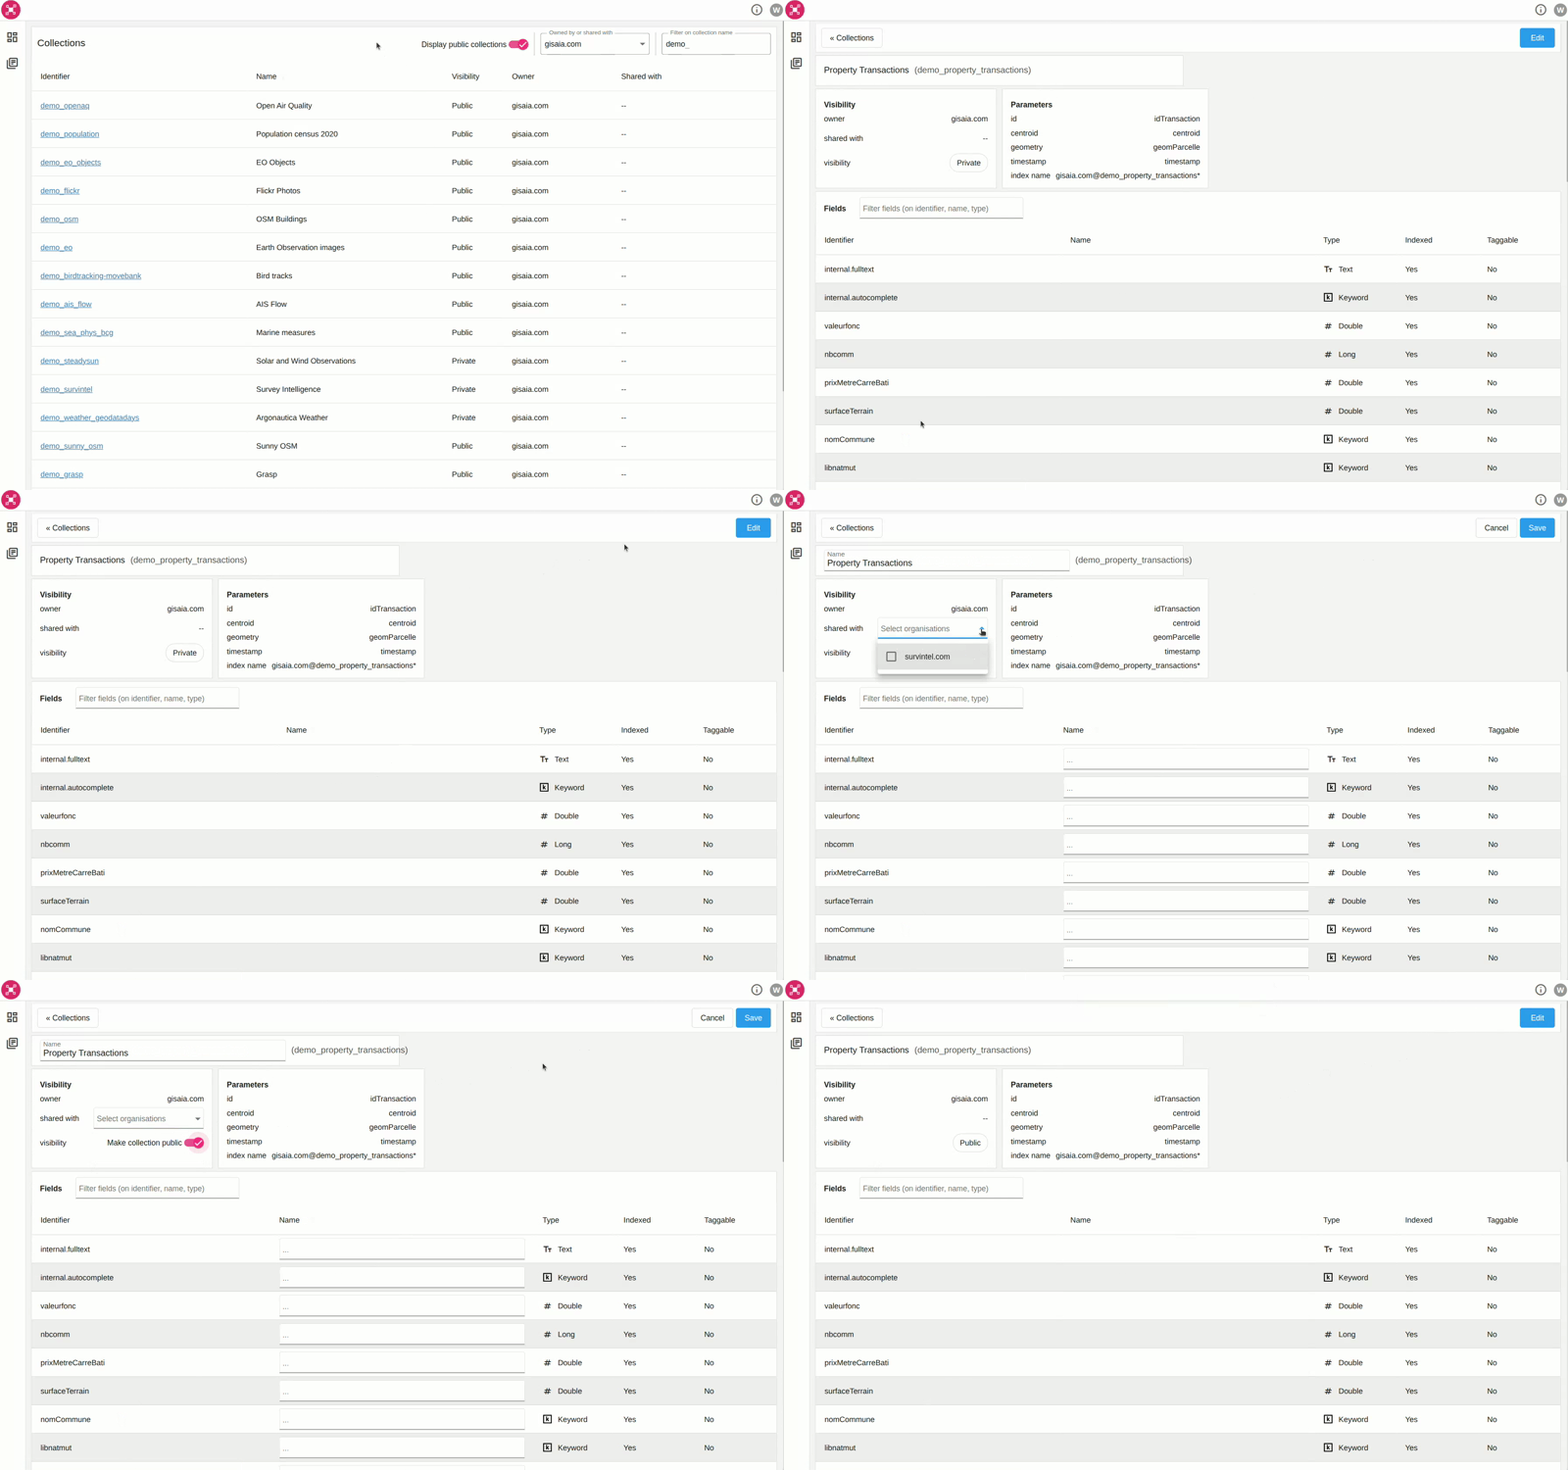
Users needed more granular control over who could see or edit their curated content without having to navigate away from their active workspace.
We added quick-access visibility and sharing settings directly from the ARLAS-Hub interface. You can now modify the visibility of a collection—switching it from private to public or shared—in just two clicks. To see this in action, explore the public dashboards on our ARLAS Wui Hub, featuring beautifully curated collections like "Marine Measures" and "Baltic Sea Exploration".
CORE FUNCTIONALITY UPDATES
Performance & Tech Stack: Angular Upgrade (v18 to v21)
While flashy features are great, a robust core is vital. We needed to ensure the application remains lightning-fast, highly secure, and perfectly compatible with the latest web standards while giving developers better tools.
We executed a massive leap, migrating the entire core framework from Angular 18 straight to Angular 21. This update delivers:
Security: Patched vulnerabilities and strengthened dependency trees.
Dependencies: Updated all third-party libraries to their latest stable versions.
UI Consistency: Standardised button components across the app for a more cohesive look and feel.
Sneak Peek: What's Next in ARLAS?
We are constantly building for the future. In our upcoming releases, you can look forward to even more capabilities, including:
Hover Values on COGs: Instantly view data values just by hovering over Cloud Optimised GeoTIFFs.
Cloud TiTiler Integration: Leveraging TiTiler in the cloud for faster, more efficient COG display.
Dynamic Column Widths: A new slider to easily adjust column widths in your datatables.
Get Started
ARLAS Version 28 is your gateway to effortlessly exploring, analysing, and visualising geo big data. Remember, don't build your Geo Data Platform from scratch; develop your geodata analytics service with ARLAS. We handle the heavy lifting so you can deliver mission-critical geospatial intelligence to your clients in record time.
Experience the power of Version 28 firsthand! We invite you to explore our live interactive dashboards on the ARLAS Demo Hub.
Ready to scale your geospatial intelligence? Contact Gisaia today or Schedule a Live Demo with our expert team to see how ARLAS can be tailored to your specific use case!
#geoanalytics #geospatial #bigdata #locationintelligence #Angular #Maplibre