NEW ARLAS RELEASE: SMOOTHER EXPLORATION AND GEOANALYTICS
INTUITIVE GEOANALYTICS
Geospatial intelligence demands a lot of data wrangling before concrete analysis can be executed.
Only when the data is aligned then can you get digging for insights. In our last major ARLAS release, version 19, we focused on making it easier for you to aggregate different types of data under our “Multi-collection” function.
Now that you are able to cross analyse your data for deeper insights, we have been working to make the exploration experience even more smoother and intuitive. Our version 21 release offers enhanced visualisation and more support for team collaboration.
SMOOTHER EXPLORATION AND ANALYTICS
The powerbar
The power bar is a nice way to quickly see the weight of a value in a dataset. However, it can be frustrating to only see a few of the values with the highest values.
Now, it is possible to have a scrollable powerbar which allows you to increase the number of values displayed in the powerbar.
You can also choose how the values are sorted by defining metrics, and choose to display them either in ascending or descending order. This is useful for identifying values based on their weight; the heaviest or the lightest values.

For example in this AIS dataset, you can easily select the fishing vessels based on the descending order of the vessel's position number.
When you have values in the powerbar, you can select the bar and the other bars are deselected. It is now possible to exclude a bar while displaying all the others.

ENHANCED DATA VISUALISATION
Metrics - edit and conditional filter
When working with the metrics, you can automatically compute an indicator on all the available data. Like, the number of trips on a certain route or the total number of distances covered by a fleet.
However, we sometimes want to compute different indicators on subsets of the data.
With the new version, you can now build more complex metrics by adding a conditional filter to select only a subset of the data.
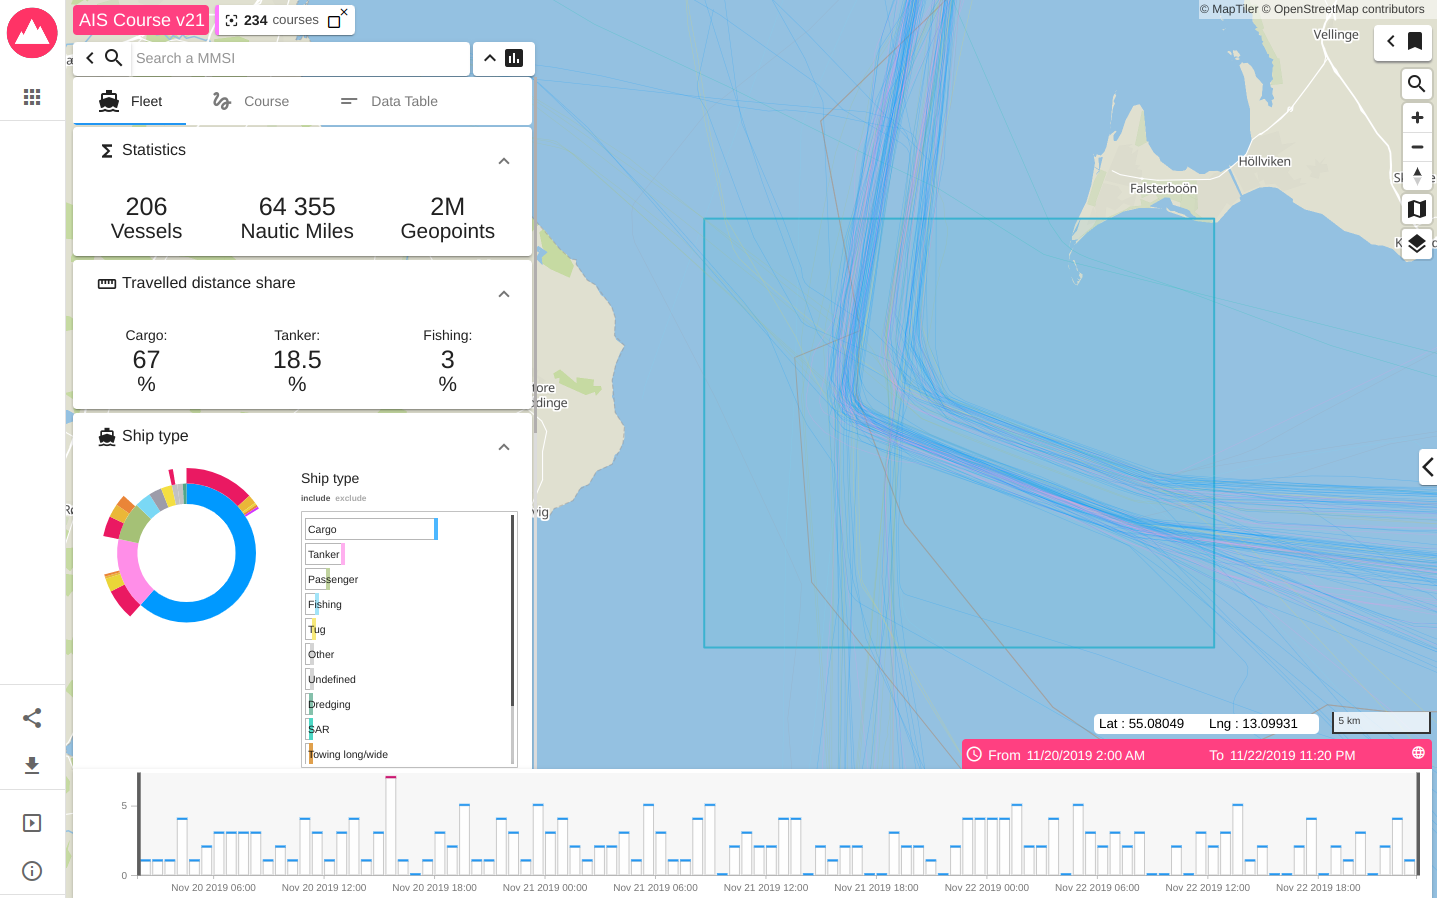
For example, in our AIS demo, we can choose to compute only the distance travelled share of cargo, tankers and fishing vessels on selected courses as illustrated below.
Label Layer
Geospatial data is not always best represented by lines and geometries. For example, text like a bus stop, building or vessel name among others.
ARLAS version 21 now allows you to display text directly on the map. The content, size, alignment and orientation can depend on data values. It is even possible to display ascii characters such as arrows.
Here are two examples from our demos that you can try out.
In AIS trips demo captured below, we can display the vessel name at the beginning and end of its trip

Below, in our maritime weather data demo, we can represent the wind speed and direction with arrows.
Icons
When you have multiple filters selected on ARLAS, it might take you time to trace your actions. Now, we have grouped the filter icons by the collection they are applied on.
And to help organise the display even further, the tabs also have icons.
For example if we have data collections on AIS courses and marine weather, we can better identify the multiple filters on the different widgets.
EASY TEAM COLLABORATION GEOANALYTICS
URL state saving
And for the bonus, the last addition supports collaboration, which is common with geoanalytics projects.
When exploring data with ARLAS, the state of your applied filters is saved in the URL which allows you to share your results with your team. With ARLAS V21 release, sharing exploration results is enhanced : you can now also save the state of displayed/hidden layers on the map, tabs of the analytic board and the data tables.
This saves time for you and your team.
Get Started
ARLAS version 21 documentation is already available here on our website and also captured on Github. You can also access our live demos where you can see the results of all the possibilities in place. Once you are ready to start, consult our tutorials and let us know how you are using ARLAS.
Our team is also available to discuss how the ARLAS framework can quickly help you build geoanalytics solutions for your data. Contact us.