ULTIMATE CUSTOMISATION FOR ENHANCED GEOSPATIAL INTELLIGENCE
MORE VISUALISATION, OPTIONS FOR YOUR GEOSPATIAL DATASET
Data visualisation is a cross between art and science.
While the most important aspect of geospatial data analysis is drawing insights, simple and clear display of the data will enhance communication. A great geospatial data analytics tool ensures that you do not compromise on the information displayed by only focusing on the data.
This is why a great tool allows you the flexibility to build a geospatial data platform that is adapted to your data.
In our latest ARLAS release, version 21, we focused on providing smoother exploration during your geoanalytics. Version 22 builds on this to offer even more data visualisation and customisation options for your dashboard and views.
STYLE THE APPEARANCE OF YOUR DISPLAY TO MATCH YOUR GEODATA VALUES
Select Basemap option
The basemap on your geodata platform acts as the canvas on which you showcase your data.
This is very important to highlight the value of your data. If you have data points, clouds or lines, the information will look different against various backgrounds; topographic, satellite, positron, dark or light street views and others.
It is not always easy to choose the one that suits you in advance, hence it is ideal to have the option to switch with your data in place.
Now, ARLAS version 22 lets you change the basemap with an instant preview that helps you make a suitable choice as shown below.

TIME SAVING SHORTCUTS TO QUICKLY GET YOU EXPLORING YOUR GEOSPATIAL DATA
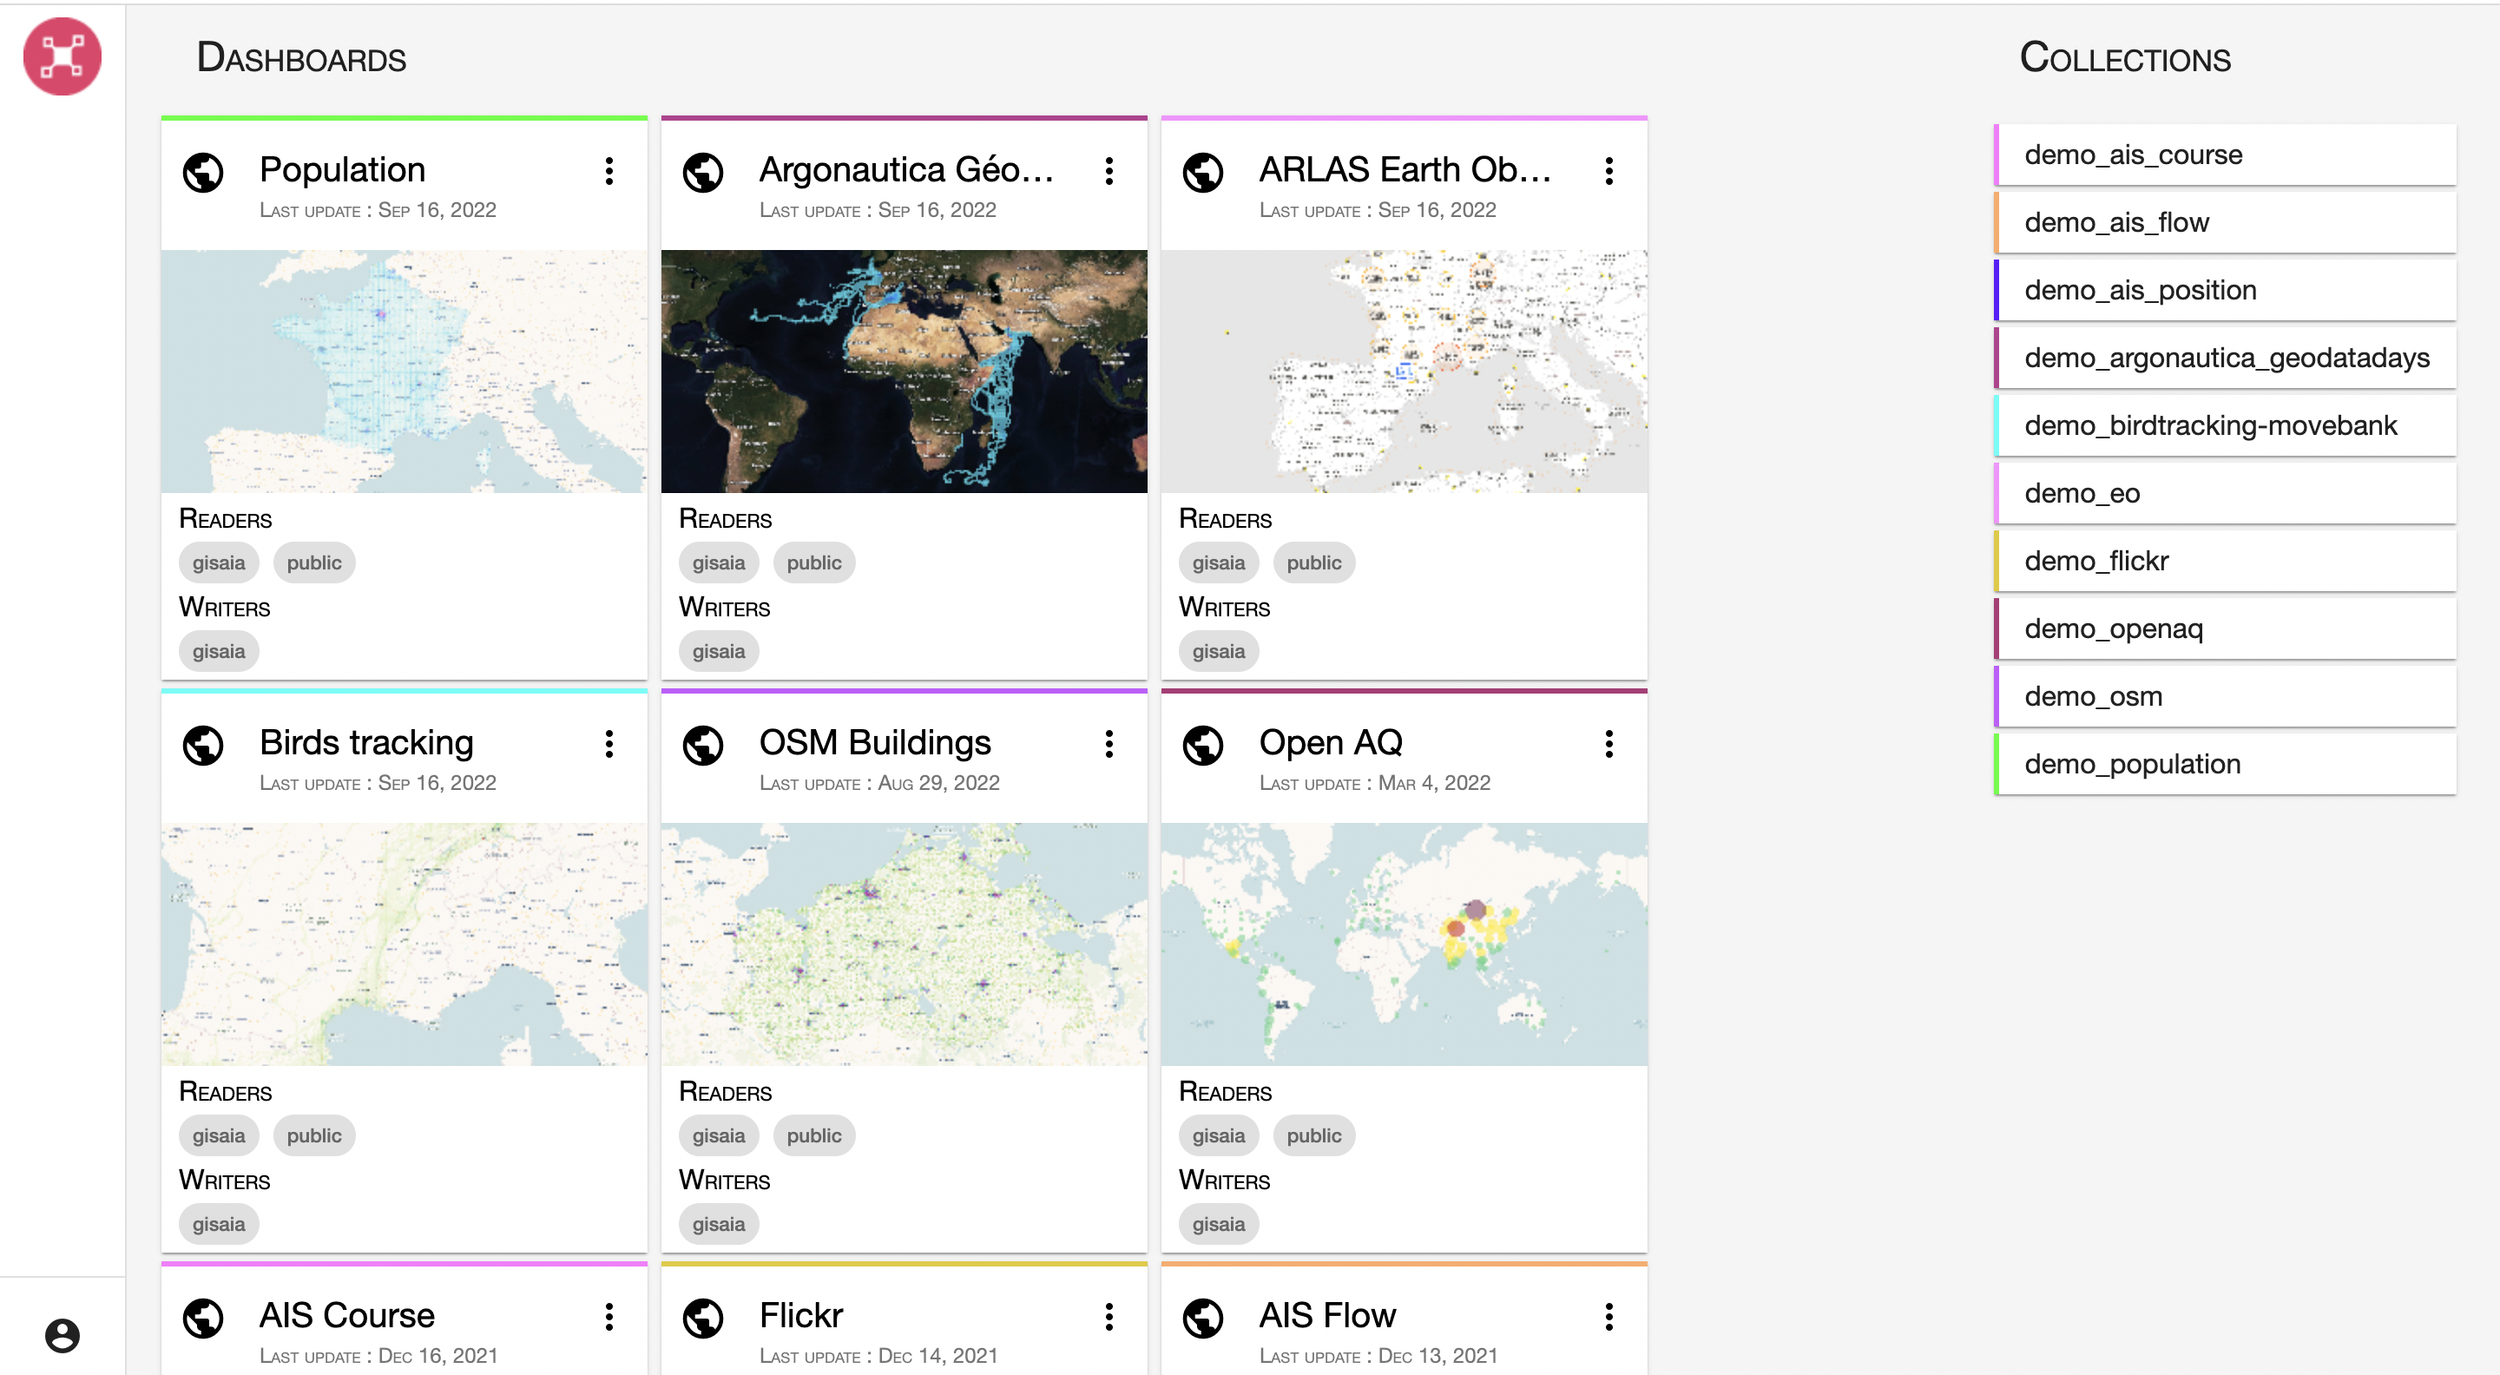
Preview in Hub
ARLAS Explo users appreciate the ability to reuse settings to quickly recreate new views of existing or new data collections. If you read our update on ARLAS v14, then you know that with time, you find yourself with several dashboards to explore. It is not easy to always remember what each dashboard contains.
A visual cue is what we offer in the version 22 release.
Now, when you look at your collection of dashboards on the ARLAS hub, it will be easier to quickly remember what is contained in each one. All you have to do is, select a view of the dashboard that will be displayed on the hub.
HOW TO SIMPLIFY THE ANALYSIS OF MULTIPLE GEOSPATIAL DATA TYPES
Map settings: Geo-filter adapted to multi-collection
One of the advantages of ARLAS Explo is the elimination of silos. Having all your related data on a single platform allows you to quickly merge and align data to grab a view of events’ links and correlations. ARLAS version 17 update made it possible to seamlessly add data from different sources with parallel spatial-temporal dimensions and get a global view.
But, when you draw over an area, you want to keep only the data that is contained within this selection. However when there are multiple collections, the rules can be different for each dataset.
ARLAS version 22 now makes it possible to quickly choose the rule of selection for each collection. Like; contains, intersects and even the geometry of the data to be applied.

Get Started
ARLAS version 22 documentation is already available here on our website and also captured on Github. You can also access our live demos where you can see the results of all the possibilities in place. Once you are ready to start, consult our tutorials and let us know how you are using ARLAS.
Our team is also available to discuss how the ARLAS framework can quickly help you build geoanalytics solutions for your data. Contact us.