ARLAS VERSION 17 REMOVES LIMITATIONS FOR DEEPER GEOSPATIAL BIG DATA ANALYTICS AND EXPLORATION
Multi collection Seeking answers to questions on whether or why a phenomenon affects another is one of the key functions of data analysis. In this case looking at different data sets independently may hint at the correct response. This would however take time.
The easiest way to observe potential correlations and causality is through displaying different data sources on the same map. Data analysts often have to look at multiple data sets to establish these relationships.
For example: An Urban planner with population, mobility and economic data seeking to choose the most optimal spot to place a new bus stop, a shopping centre or other amenities like schools or primary care centres.A marine digital tools provider might want to offer more to their customers than just the ability to track their vessels.
Say their clients want to know the best route to take to a certain destination, metrics on weather, fuel consumption and historic vessel data may provide the answer to this and other questions.Being able to display and analyse multiple collections simultaneously in the same application and cross the information is now possible with ARLAS version 17 configuration.
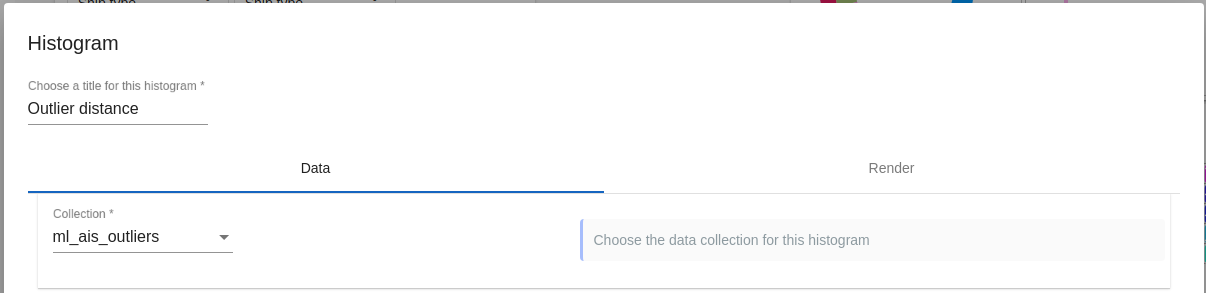
ARLAS does this by linking each widget or layer to a collection. It can then be displayed for interaction with different data sources simultaneously. All you have to do is choose your sources and display all your data on the same dashboard.
New aggregation grid (square)
Naturally you want to smoothly visualise your data once you have it all in place. With ARLAS, all the data is geographically aggregated over a grid to produce a heatmap and quickly visualise the flux. The precision of the grid is adapted to the zoom level in the applicationUntil v16, ARLAS proposed the geohash Grid only. In this grid, the cells are rectangles and the transitions between two levels of aggregation are quite important steps: a cell is subdivided into 32 cells at each transition.
Zoom over AIS data with Geohash Grid (3 intermediate steps)

Now in ARLAS 17, a new Geotile Grid aggregation is available. The cells are squared, respect the x/y/z tiling system and allow more intermediate zoom levels: a cell is subdivided into 4 cells at each transition. It results in a smoother behavior when navigating within the data. This function supports data analysts in their storytelling.
Zoom over ais data with Geotile Grid (6 intermediate steps)
Get Started ARLAS version 18 documentation is already available here on our website and also captured on Github. You can also access our live demos where you can see the results of all the possibilities in place. Once you are ready to start, consult our tutorials and let us know how you are using ARLAS.